
 At Symphony, we help to turn your industry data into
knowledge so that knowledgeable insights will help you in
making sound decisions. We bring analytical maturity to the
organizations making them smarter to work more efficiently
and plan effectively.
At Symphony, we help to turn your industry data into
knowledge so that knowledgeable insights will help you in
making sound decisions. We bring analytical maturity to the
organizations making them smarter to work more efficiently
and plan effectively.
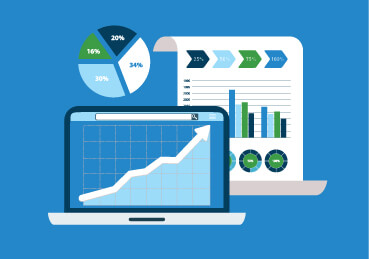
 Data visualization is actually descriptive statistics used as a
tool of visual communication, which involves creating and
studying the visual representation of data. We
communicate complex data clearly and intuitively to a
targeted audience via a combination of charts, graphs,
tables, etc.
Data visualization is actually descriptive statistics used as a
tool of visual communication, which involves creating and
studying the visual representation of data. We
communicate complex data clearly and intuitively to a
targeted audience via a combination of charts, graphs,
tables, etc.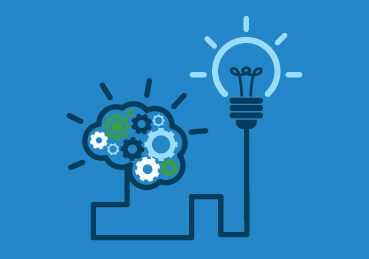 We empower businesses to meet the today’s demands
while planning for tomorrow. Our unique data-tointelligence
approach pushes us to our limits in offering
integrated business intelligence strategy approach helping
in data-driven decision-making.
We empower businesses to meet the today’s demands
while planning for tomorrow. Our unique data-tointelligence
approach pushes us to our limits in offering
integrated business intelligence strategy approach helping
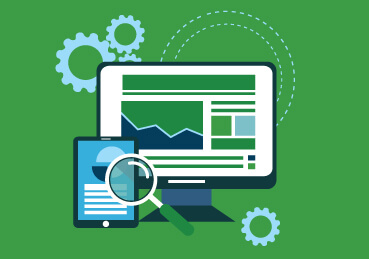
in data-driven decision-making. Day-by-day big data is growing in volume, variety, velocity,
and complexity. We will help you implement the
technologies you need to manage and understand your
data – allowing you to predict customer demand and make
better decisions faster than ever before.
Day-by-day big data is growing in volume, variety, velocity,
and complexity. We will help you implement the
technologies you need to manage and understand your
data – allowing you to predict customer demand and make
better decisions faster than ever before. By assessing your enterprise’s unique needs and
opportunities we design a precise solution and process
improvements offering a data delivery strategy helping
organizations to govern what data is collected, how it is
stored and integrated, who has access and what level of
protection it needs.
By assessing your enterprise’s unique needs and
opportunities we design a precise solution and process
improvements offering a data delivery strategy helping
organizations to govern what data is collected, how it is
stored and integrated, who has access and what level of
protection it needs. Anything you need in sales cycle analysis, lead conversion,
RFM, Cross sell/Upsell opportunity, online ad spends, churn
analysis, marketing mix optimization, segmentation, to
customer profiling will be provided to you with tangible
insights to take better and efficient decisions to enhance
marketing productivity.
Anything you need in sales cycle analysis, lead conversion,
RFM, Cross sell/Upsell opportunity, online ad spends, churn
analysis, marketing mix optimization, segmentation, to
customer profiling will be provided to you with tangible
insights to take better and efficient decisions to enhance
marketing productivity.